by Keith Burnett
The astronomical functions were taken from
and other sources.
Extensions by R. Grothmann.
>load astro;
Click on the following link to see a list of functions.
Use day to set a specific date. The function returns the days since 2000.
>now = day(2008, 1, 2, 22, 00)
2923.41666667
For later use, we save the current year, month and day in month. The time is in UTC (universal time coordinated).
>v=getnow(1), year=v[1]; month=v[2]; dmonth=v[3];
[2014, 8, 1, 9, 2, 58, 165]
This is the current Gregorian day number in UTC.
>now = daynow(1)
5325.87706228
This is the offset in hours relative to utc.
>utcoffset = round(24*(daynow(0)-daynow(1)))
2
This is the Julian date.
>long jday(2008, 1, 2, 22, 00)
2454468.41667
>long jdaynow()
2456870.87706
The Greenwich sidereal time in degrees.
>gst(now)
85.6397470722
Let us compute the geocentric coordinates of the sun. In Winter, the declination is negative. The distance is in astronomical units.
>psun = sun(now)
[131.488, 17.989, 1.01497]
>gmoon = moon(now)
[187.323, -4.44876, 399321]
You can set a variable like this for your own location (longitude in °, latitude in °, altitude in m).
>locIngolstadt
[11.433, 48.767, 400]
Now, we add the temperature (in C°) and the barometric pressure (in HP).
>here = [locIngolstadt,0,1020]
[11.433, 48.767, 400, 0, 1020]
We can then compute the altitude and azimuth of the sun. The function raltaz() corrects for refraction.
>raltaz(now, here, psun)
[125.717, 48.5564]
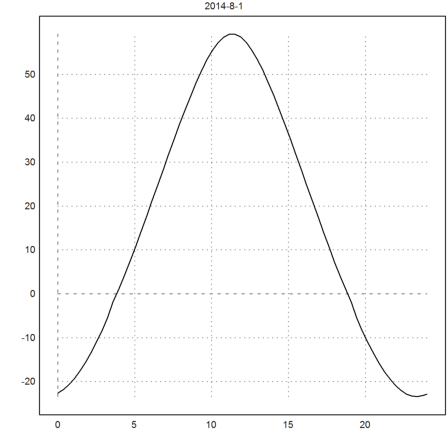
To compute a graph of the altitudes of the sun, we need a function, which returns the altitude at any time.
>function altSun (now,loc=here) ...
 r=raltaz(now,loc,sun(now));
 return r[2];
 endfunction
Now we can plot the altitude of the sun today depending on the hour.
>plot2d("altSun(day(year,month,dmonth,x,0))",a=0,b=24,n=40, ...
   title=year+"-"+month+"-"+dmonth):
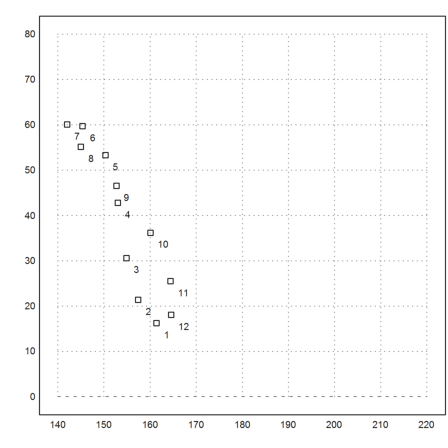
We want to plot the sun at 12 o'clock local time over the year.
>function plotSun12 (year,hour=12,loc=here) ...
 plot2d(none,140,220,0,80);
 loop 1 to 12
   d=day(year,#,1,hour,0);
   r=raltaz(d,loc,sun(d));
   plot2d(r[1],r[2],>points,style="[]",>add);
   label(""+#,r[1],r[2]);
 end;
 endfunction
For summer time, use 13 instead of 12.
>plotSun12(year,12-utcoffset,here):
We can compute the sunrise with the bisection method now.
>hmsprint(secant("altSun(day(year,month,dmonth,x,0))",0,12,y=-0.5))
03:44:57
The time marks the point, where the sun is half a degree under the horizon.
And likewise the sunset.
>hmsprint(secant("altSun(day(year,month,dmonth,x,0))",12,24,y=-0.5))
18:55:24
The highest point of the sun is also easily computed.
Note: all times are in UTC!
>hmsprint(fmax("altSun(day(2008,1,2,x,0))",10,12))
11:18:07
There is a function, which does that automatically. It computes the next rise after a given day.
>printday(rise("sun",now,here))
2014-08-02 03:50:30
Also the next sunset.
>printday(set("sun",now,here))
2014-08-01 18:51:11
Next we make a general function, which compute the next even "rise" or "set" after a given date.
>function map computehour (month,year,planet;loc,compute) ...
 now=day(year,floor(month),floor((month-floor(month))*30)+1);
 r=compute(planet,now,loc);
 t=getymdhms(r);
 return t[4]+t[5]/60+t[6]/3600;
 endfunction
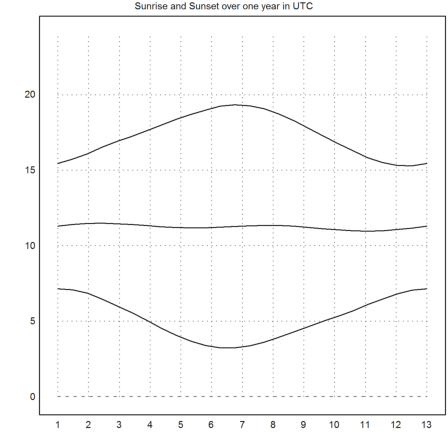
Plot the sunrises over one year. This is a bit slow. Please be patient!
>plot2d("computehour";2008,"sun",here,"rise",a=1,b=13,c=0,d=24,n=25,adaptive=0);
Add the sunsets over one year.
>plot2d("computehour";2008,"sun",here,"set",a=1,b=13,n=25,add=1,adaptive=0);
Add the times of highest altitude.
>plot2d("computehour";2008,"sun",here,"highest",a=1,b=13,n=25,add=1,adaptive=0);
>title("Sunrise and Sunset over one year in UTC"):
Moon rise and set in UTC.
>printday(rise("moon",now,here)), ...
 printday(set("moon",now,here))
2014-08-01 09:21:24
2014-08-01 20:59:51
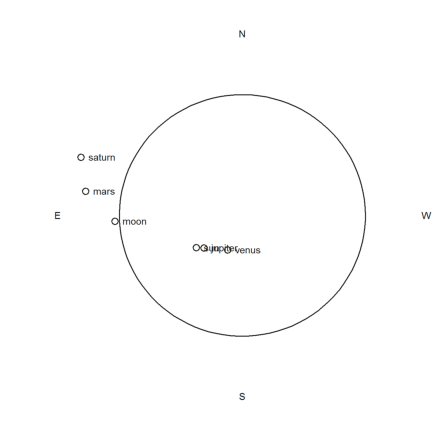
The following plots the sky at the current time
>function plotsky (now,loc=here,r=1.5) ...
 plot2d("cos(x)","sin(x)",xmin=0,xmax=2pi,=r,<grid);
 sp=["sun","moon","venus","mars","jupiter","saturn"];
 loop 1 to cols(sp)
   r=raltaz(now,loc,sp[#](now));
   x=cos(rad(270-r[1]))*((90-r[2])/90);
   y=-sin(rad(270-r[1]))*((90-r[2])/90);
   plot2d(x,y,>points,>add,style="o");
   label(sp[#],x,y,pos="cr");
 end;
 label("S",0,-1.5,pos="cc"); label("N",0,1.5,pos="cc");
 label("E",-1.5,0,pos="cc"); label("W",1.5,0,pos="cc");
 endfunction
>plotsky(now):