You will often want to import a matrix of data from other sources to EMT. This tutorial tells you about the many ways to achieve this.
First, let us write a matrix into a file. For the output, we generate a file in the home directory of Euler. The function eulerhome() returns a subdirectory "Euler" in the home directory of the user. This is usually "c:\users\username\Euler".
>file=eulerhome()+"test.csv";  ...
 M=random(3,3); writematrix(M,file);
Here is the content of this file.
>printfile(file)
0.6554163483485531,0.2009951854518572,0.8936223876466523
0.2818865431288053,0.5250003829714993,0.3141267749950177
0.4446156782993733,0.2994744556282315,0.2826898577756425
This CVS can be opened on English systems into Excel by a double click. If you get such a file on a German system, you need to import the data into Excel taking care of the decimal dot.
But the decimal dot is the default format for EMT too. You can read a matrix from a file with readmatrix().
>readmatrix(file)
     0.655416      0.200995      0.893622
     0.281887         0.525      0.314127
     0.444616      0.299474       0.28269
It is possible to write several matrices to one file. The open() command can open a file for writing with the "w" parameter. The default is "r" for reading.
>open(file,"w"); writematrix(M); writematrix(M'); close();
The matrices are separated by a blank line. To read the matrices, open the file and call readmatrix() several times.
>open(file); A=readmatrix(); B=readmatrix(); A==B, close();
            1             0             0
            0             1             0
            0             0             1
In Excel or similar spreadsheets, you can export a matrix as CSV (comma separated values). In Excel 2007, use "save as" and "other formats", then select "CSV". Make sure, the current table contains only data you wish to export.
Here is an example.
>printfile("excel-data.csv")
0;1000;1000
1;1051,271096;1072,508181
2;1105,170918;1150,273799
3;1161,834243;1233,67806
4;1221,402758;1323,129812
5;1284,025417;1419,067549
6;1349,858808;1521,961556
7;1419,067549;1632,31622
8;1491,824698;1750,6725
9;1568,312185;1877,610579
10;1648,721271;2013,752707
As you can see, my German system has used a semicolon as separator and a decimal comma. You can can change this in the system settings or in Excel, but it is not necessary for reading the matrix into EMT.
The easiest way to read this into Euler is readmatrix(). All commas are replaced by dots with the parameter >comma. For English CSV, simply omit this parameter.
>M=readmatrix("excel-data.csv",>comma)
0 1000 1000
1 1051.27 1072.51
2 1105.17 1150.27
3 1161.83 1233.68
4 1221.4 1323.13
5 1284.03 1419.07
6 1349.86 1521.96
7 1419.07 1632.32
8 1491.82 1750.67
9 1568.31 1877.61
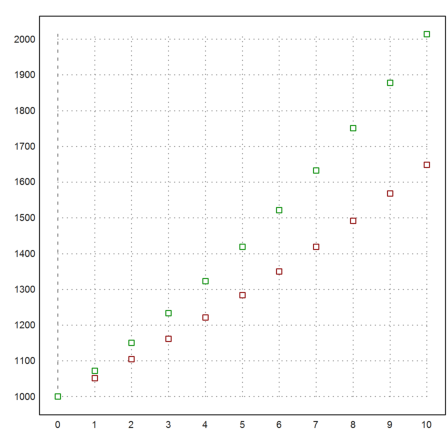
10 1648.72 2013.75
Let us plot this.
>plot2d(M'[1],M'[2:3],>points,color=[red,green]'):
There are more elementary ways to read data from a file. You can open the file and read the numbers line by line. The function getvectorline() will read numbers from a line of data. By default, it expects a decimal dot. But it can also use a decimal comma, if you call setdecimaldot(",") before you use this function.
The following function is an example for this. It will stop at the end of the file or an empty line.
>function myload (file) ...
 open(file);
 M=[];
 repeat
    until eof();
    v=getvectorline(3);
    if length(v)>0 then M=M_v; else break; endif;
 end;
 return M;
 close(file);
 endfunction
>myload(file)
     0.655416      0.200995      0.893622
     0.281887         0.525      0.314127
     0.444616      0.299474       0.28269
It would also be possible to read all numbers in that file with getvector().
>open(file); v=getvector(10000); close(); redim(v[1:9],3,3)
     0.655416      0.200995      0.893622
     0.281887         0.525      0.314127
     0.444616      0.299474       0.28269
Thus it is very easy to save a vector of values, one value in each line and read back this vector.
>v=random(1000); mean(v)
0.501290304338
>writematrix(v',file); mean(readmatrix(file)')
0.501290304338
Tables are explained in great detail in the
But they can also be used to read or write numerical data. For an example, we write a table with row and column headers to a file.
>file=eulerhome()+"test.tab"; M=random(3,3);  ...
 open(file,"w");  ...
 writetable(M,separator=",",labc=["one","two","three"]);  ...
 close(); ...
 printfile(file)
one,two,three
      0.87      0.56      0.16
      0.93      0.84      0.62
      0.99      0.87      0.59
This can be imported into Excel.
To read the file in EMT, we use readtable().
>{M,headings}=readtable(file,>clabs); ...
 writetable(M,labc=headings)
       one       two     three
      0.87      0.56      0.16
      0.93      0.84      0.62
      0.99      0.87      0.59
You could even evaluate each line by hand. Suppose, we have a line of the following format.
>line="2014-02-25,Wed,1'114.05"
2014-02-25,Wed,1'114.05
First we can tokenize the line.
>vt=strtokens(line)
2014-02-25
Wed
1'114.05
Then we can evaluate each element of the line using appropriate evaluations.
>day(vt[1]),  ...
 indexof(["mon","tue","wed","thu","fri","sat","sun"],tolower(vt[2])),  ...
 strrepl(vt[3],"'","")()
735719
3
1114.05
Using regular expressions, it is possible to extract almost any information from a line of data.
Assume we have the following line an HTML document.
>line="<tr><td>1145.45</td><td>5.6</td><td>-4.5</td><tr>"
<tr><td>1145.45</td><td>5.6</td><td>-4.5</td><tr>
To extract this, we use a regular expression, which searches for
 - a closing bracket >,
 - any string not containing brackets with a sub-match "(...)",
 - an opening and a closing bracket using the shortest solution,
 - again any string not containing brackets,
 - and an opening bracket <.
Regular expressions are somewhat difficult to learn but very powerful.
>{pos,s,vt}=strxfind(line,">([^<>]+)<.+?>([^<>]+)<");
The result is the position of the match, the matched string, and a vector of strings for sub-matches.
>for k=1:length(vt); vt[k](), end;
1145.45
5.6
Here is a function, which reads all numerical items between <td> and </td>.
>function readtd (line) ...
 v=[]; cp=0;
 repeat
    {pos,s,vt}=strxfind(line,"<td.*?>(.+?)</td>",cp);
    until pos==0;
    if length(vt)>0 then v=v|vt[1]; endif;
    cp=pos+strlen(s);
 end;
 return v;
 endfunction
>readtd(line+"<td>non-numerical</td>")
1145.45
5.6
-4.5
non-numerical
>function readversion () ...
 urlopen("http://www.euler-math-toolbox.de/Programs/Changes.html");
 repeat
   until urleof();
   s=urlgetline();
   k=strfind(s,"Current Version ",1);
   if k>0 then substring(s,k,strfind(s,"<",k)-1), break; endif;
 end;
 urlclose();
 endfunction
>readversion
Current Version 2014-12-20
A web site or a file with an URL can be opened in EMT and can be read line by line.
In the example, we read the current version from the EMT site. We use regular expression to scan for "Current Version ..." in a heading.
>function readversion () ...
 urlopen("http://www.euler-math-toolbox.de/Programs/Changes.html");
 repeat
   until urleof();
   s=urlgetline();
   {k,s,vt}=strxfind(s,"<h1.+?>Current Version (.+?)</h1>",1);
   if k>0 then vt[1], endif;
 end;
 urlclose();
 endfunction
>readversion
2014-12-20
2014-12-20</a>
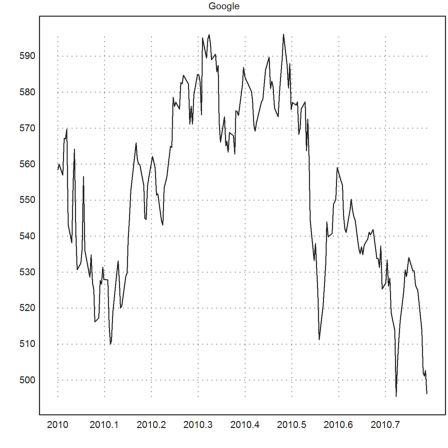
Yahoo is providing a service with historical stock data. The CVS file looks like this.
>urlopen("http://ichart.finance.yahoo.com/table.csv?s=GOOG&"+ ...
    "a=1&b=1&c=2010&d=1&e=1&f=2011&g=d&ignore.csv");
From this URL, we first get a heading line.
>urlgetline()
<!doctype html public "-//W3C//DTD HTML 4.01//EN" "http://www.w3.org/TR/html4/strict.dtd">
Then we get lines of data as follows.
>urlgetline()
<html><head><title>Yahoo! - 404 Not Found</title><style>
We should close the URL.
>urlclose();
The following function read the data since a given date.
>function getstock(stock,since) ...
 s="http://ichart.finance.yahoo.com/table.csv?s="+stock;
 {y,m,d}=date(since); s=s+''&a=''+(m-1)+''&b=''+d+''&c=''+y;
 {y,m,d}=date(daynow); s=s+''&d=''+(m-1)+''&e=''+d+''&f=''+y;
 s=s+''&g=d&ignore.csv'';
 v=[];
 urlopen(s);
 heading=strtokens(urlgetline(),",");
 repeat
    line=strtokens(urlgetline(),",");
    if length(line)<2 then break; endif;
    date=day(line[1]);
    value=line[5]();
    v=v_[date,value];
    until urleof();
 end;
 urlclose();
 return flipud(v);
 endfunction
>S=getstock("GOOG",day("2010-01-01"))'; ...
 plot2d((S[1]-S[1,1])/365.25+2010,S[2],title="Google"):
You can write a variable in the form of an Euler definition to a file or to the command line.
>writevar(pi,"mypi");
mypi = 3.141592653589793;
For a test, we generate an Euler file in the work directory of EMT.
>file=eulerhome()+"test.e"; ...
 writevar(random(2,2),"M",file); ...
 printfile(file,3)
M = [ ..
0.1898805951419522, 0.9062385233260106;
0.4965437809965673, 0.1011022159800345];
We can now load the file. It will define the matrix M.
>load(file); show M,
M =
     0.189881      0.906239
     0.496544      0.101102
By the way, if writevar() is used on a variable, it will print the variable definition with the name of this variable.
>writevar(M); writevar(inch$)
M = [ ..
0.1898805951419522, 0.9062385233260106;
0.4965437809965673, 0.1011022159800345];
inch$ = 0.0254;
We can also open a new file or append to an existing file. In the example we append to the previously generated file.
>open(file,"a"); ...
 writevar(random(2,2),"M1"); ...
 writevar(random(3,1),"M2"); ...
 close();
>load(file); show M1; show M2;
M1 =
     0.327321      0.865667
     0.186415      0.578671
M2 =
     0.290616
    0.0797581
       0.5855
To remove any files use fileremove().
>fileremove(file);
A row vector in a file does not need commas, if each number is in a new line. Let us generate such a file, writing every line one by one with writeln().
>open(file,"w"); writeln("M = ["); ...
 for i=1 to 5; writeln(""+random()); end; ...
 writeln("];"); close(); ...
 printfile(file)
M = [
0.963592746251
0.856543922241
0.328308284239
0.0981508550899
0.254531850403
];
>load(file); M
[0.963593, 0.856544, 0.328308, 0.0981509, 0.254532]
To get the Latex code of a symbolic expression, Maxima has the function tex(). For symbolic expressions in EMT, this function can be used to get the code.
>tex(&a/b),
\frac{a}{b}
For a matrix, this does also work.
>M&=[a,b;c,3]; tex(M)
\begin{pmatrix}a & b \\ c & 3 \\ \end{pmatrix}
Of a numerical matrix, you can use Maxima only, if you transfer the matrix to Maxima first.
>M=random(2,2); mxmset(M); tex("M")
\begin{pmatrix}0.59057500548608 & 0.24454150012975 \\
 0.68372204206715 & 0.82519853680482 \\ \end{pmatrix}
There is a function writelatex(), which works for numerical data too. It does accept a format string in C format.
>writelatex(M,"%0.16g")
\begin{pmatrix}
0.5905750054860839 & 0.2445415001297498 \\
0.6837220420671504 & 0.8251985368048193
\end{pmatrix}
The function writeformat() is a very flexible one. Here separators can been be set for the columns and the rows.
>M=random(3,2); writeformat(M,"%0.5f",sep1=" | ",sep2="")
0.32702 | 0.50136
0.58172 | 0.02845
0.72032 | 0.27668
It is also possible to use own formats. The following is a typical formatting function. It takes a value x and returns a string.
>function myformat(x:real scalar) := print(x,2,sep=" ",dot=",");
Here is an example. The separation character is used in print() to separate digits in groups of 3.
>myformat(123456.789)
123 456,79
Now we can pass the formatting function to writeformat().
>writeformat(M*10000,"myformat",sep1=" ",sep2="")
  3 270,18   5 013,59
  5 817,19     284,50
  7 203,21   2 766,78
By the way, it is possible to use such a format for all output. Let us try this with a fractional format.
>function myformat(x:real scalar) := printstr(frac(x),8);
>userformat("myformat"); intrandom(3,3,10)/intrandom(3,3,10)
       1        1        2
     2/5      7/6      5/4
     8/3      2/9      3/2
Note that the output length will not affect row vectors or reals.
>[1:5]/3, 8/3
[1/3,  2/3,  1,  4/3,  5/3]
8/3
You can call denseoutput(0) to release the dense format for row vectors.
>denseoutput(0); [1:5]/3
1/3 2/3 1 4/3 5/3
To revert to the default format, use defformat() or reset().
>defformat();